Bringing Visual Graph Debugging to Custom Edge Compilers with Model Explorer
Google Model Explorer工具通过可视化调试解决边缘设备模型部署难题,支持Arm自定义编译器IR验证与性能分析。
入选理由:Model Explorer支持VGF/TOSA/PTE格式,可检测ExecuTorch后端引入的TRANSPOSE操作符问题
产品
Google开发的可视化模型调试工具
已跟踪 2 条高相关材料
最近变化
2026-10-20 · Model Explorer支持VGF/TOSA/PTE格式,可检测ExecuTorch后端引入的TRANSPOSE操作符问题
为什么值得关注
Model Explorer 被反复提及时,通常意味着它正在影响产品路线、开发者工作流或 AI 产业判断。这个页面把分散材料合并成一个可持续更新的观察入口。
Bringing Visual Graph Debugging to Custom Edge Compilers with Model Explorer
Google Developers Blog · 8.5 分
Google Model Explorer工具通过可视化调试解决边缘设备模型部署难题,支持Arm自定义编译器IR验证与性能分析。
Benchmark and optimize LLMs on-device with AI Edge Portal
Google Cloud Blog · 8.5 分
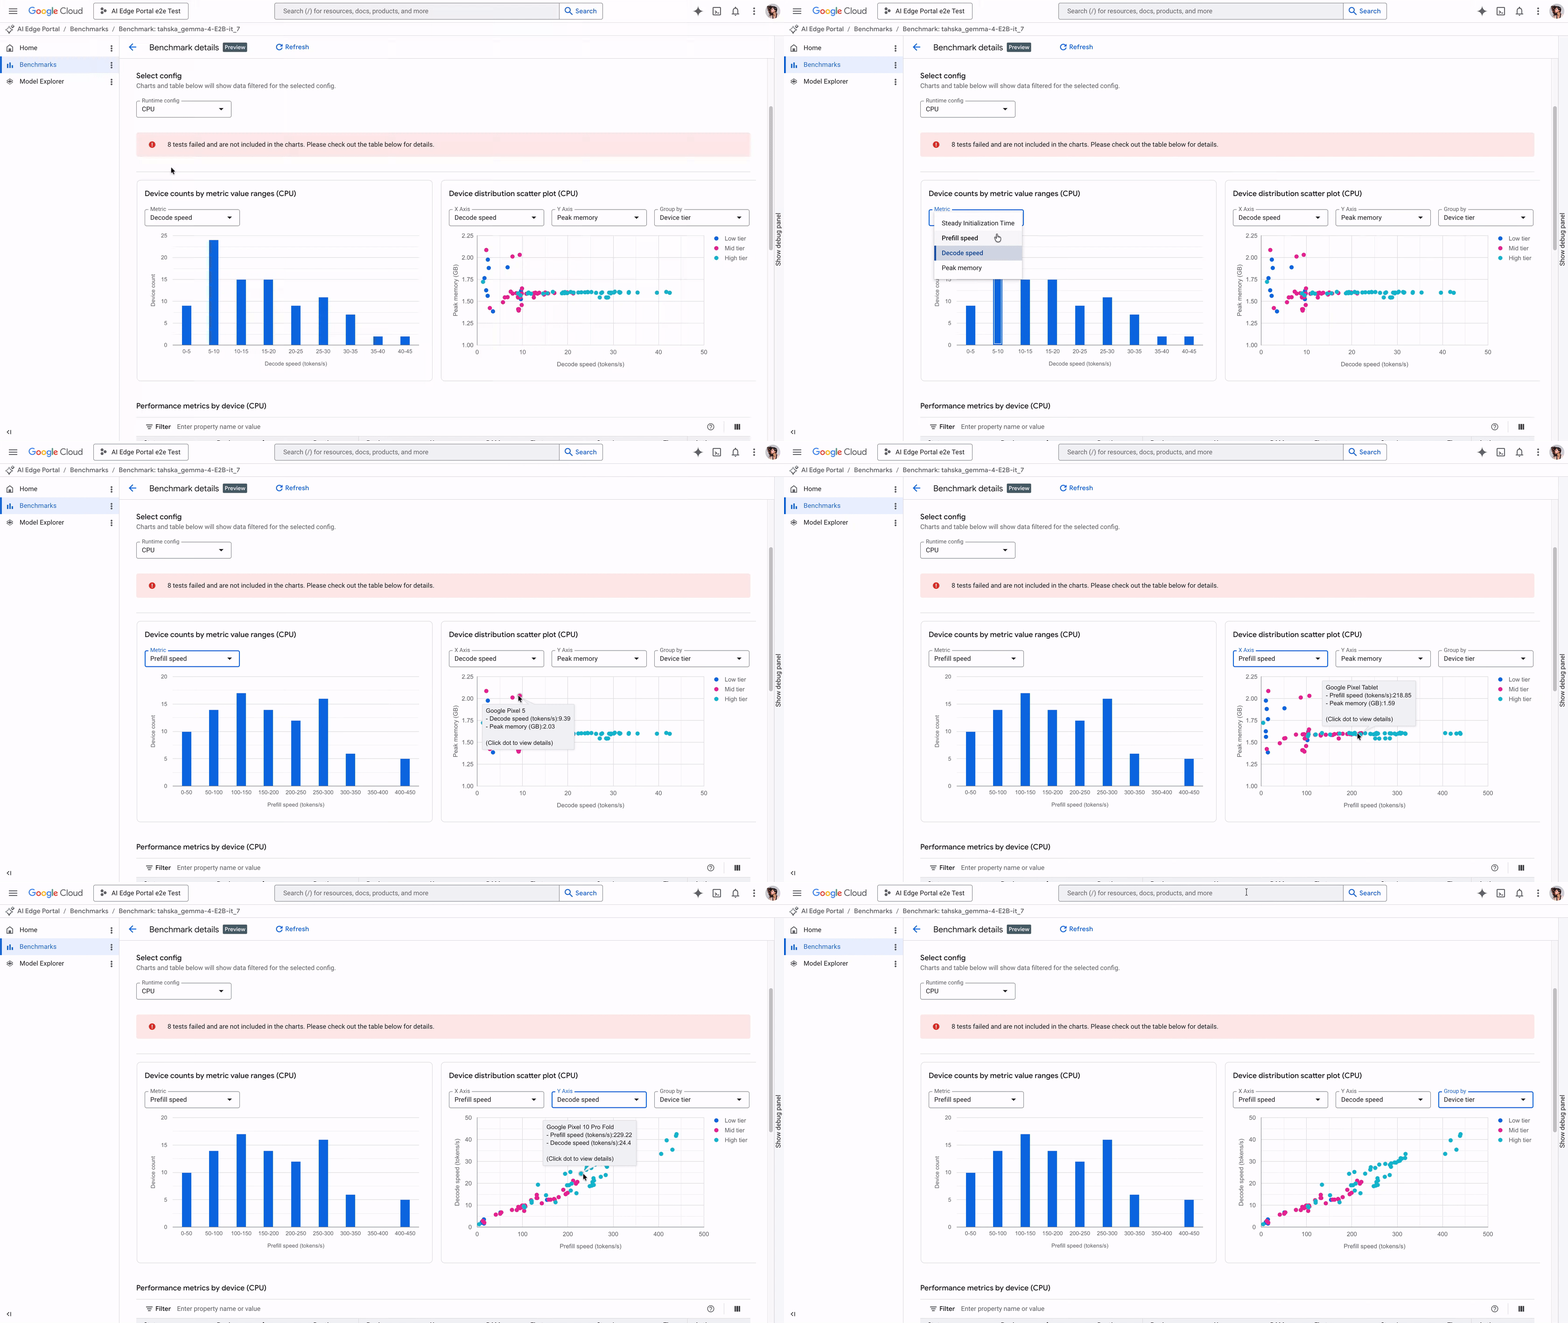
Google AI Edge Portal新增LLM基准测试和调试功能,支持在120+ Android设备上优化模型性能,提供初始化时间、解码速度等关键指标分析及可视化调试工具。
已收录 2 条与 Model Explorer 相关的内容,按评分排序。
Google Model Explorer工具通过可视化调试解决边缘设备模型部署难题,支持Arm自定义编译器IR验证与性能分析。
入选理由:Model Explorer支持VGF/TOSA/PTE格式,可检测ExecuTorch后端引入的TRANSPOSE操作符问题
Google AI Edge Portal introduces new LLM benchmarking and debugging capabilities, enabling performance optimization across over 120 Android devices with key metrics like initialization time and decode speed analysis, plus visualization tools.
入选理由:AI Edge Portal支持在120+ Android设备上测试LLM,提供初始化时间、预填速度等4项核心性能指标