Approximate Answers, Exact Decisions: New Sketch Functions for Analytics

- 新的Sketch函数可以提供近似答案,加速数据分析过程。
- 这些函数适用于大规模数据集的快速处理和初步分析。
- Databricks平台支持这些新功能,以提高数据处理效率。
Approximate Answers, Exact Decisions: New Sketch Functions for Analytics | Databricks Blog
[](http://www.databricks.com/)
[](http://www.databricks.com/)
- Why Databricks
- * Discover
- Customers
- Partners
- Product
- * Databricks Platform
- Integrations and Data
- Pricing
- Open Source
- Solutions
- * Databricks for Industries
- Cross Industry Solutions
- Migration & Deployment
- Solution Accelerators
- Resources
- * Learning
- Events
- Blog and Podcasts
- Get Help
- Dive Deep
- About
- * Company
- Careers
- Press
- Security and Trust
- DATA + AI SUMMIT 
Table of contents
- Percentile calculations in milliseconds, not minutes
- Audience overlap analysis without the compute bill
- Real-time leaderboards without reprocessing raw data
- Cardinality and revenue attribution in one pass
- Getting started with the right sketch
Table of contents
Table of contents
- Percentile calculations in milliseconds, not minutes
- Audience overlap analysis without the compute bill
- Real-time leaderboards without reprocessing raw data
- Cardinality and revenue attribution in one pass
- Getting started with the right sketch
ProductApril 29, 2026
Approximate Answers, Exact Decisions: New Sketch Functions for Analytics
Four new sketch functions in Databricks speed up percentiles, distinct counts, and top-K queries by orders of magnitude
by Daniel Tenedorio, Kent Marten, Gengliang Wang and Chenhao Li
Summary
- Percentiles in milliseconds, not minutes: KLL quantile sketches compute P50, P90, P99 over massive datasets in constant memory. Store sketches and merge them for instant incremental updates.
- Audience overlap at a fraction of the cost: Theta and Tuple sketches perform unions, intersections, and set differences on distinct value sets. Tuple sketches also associate metrics (sums, mins, maxes) with each key for combined counting and aggregation.
- Real-time trending without reprocessing: Approximate top-K functions identify the most frequent items in bounded memory, mergeable across time windows.
Expand
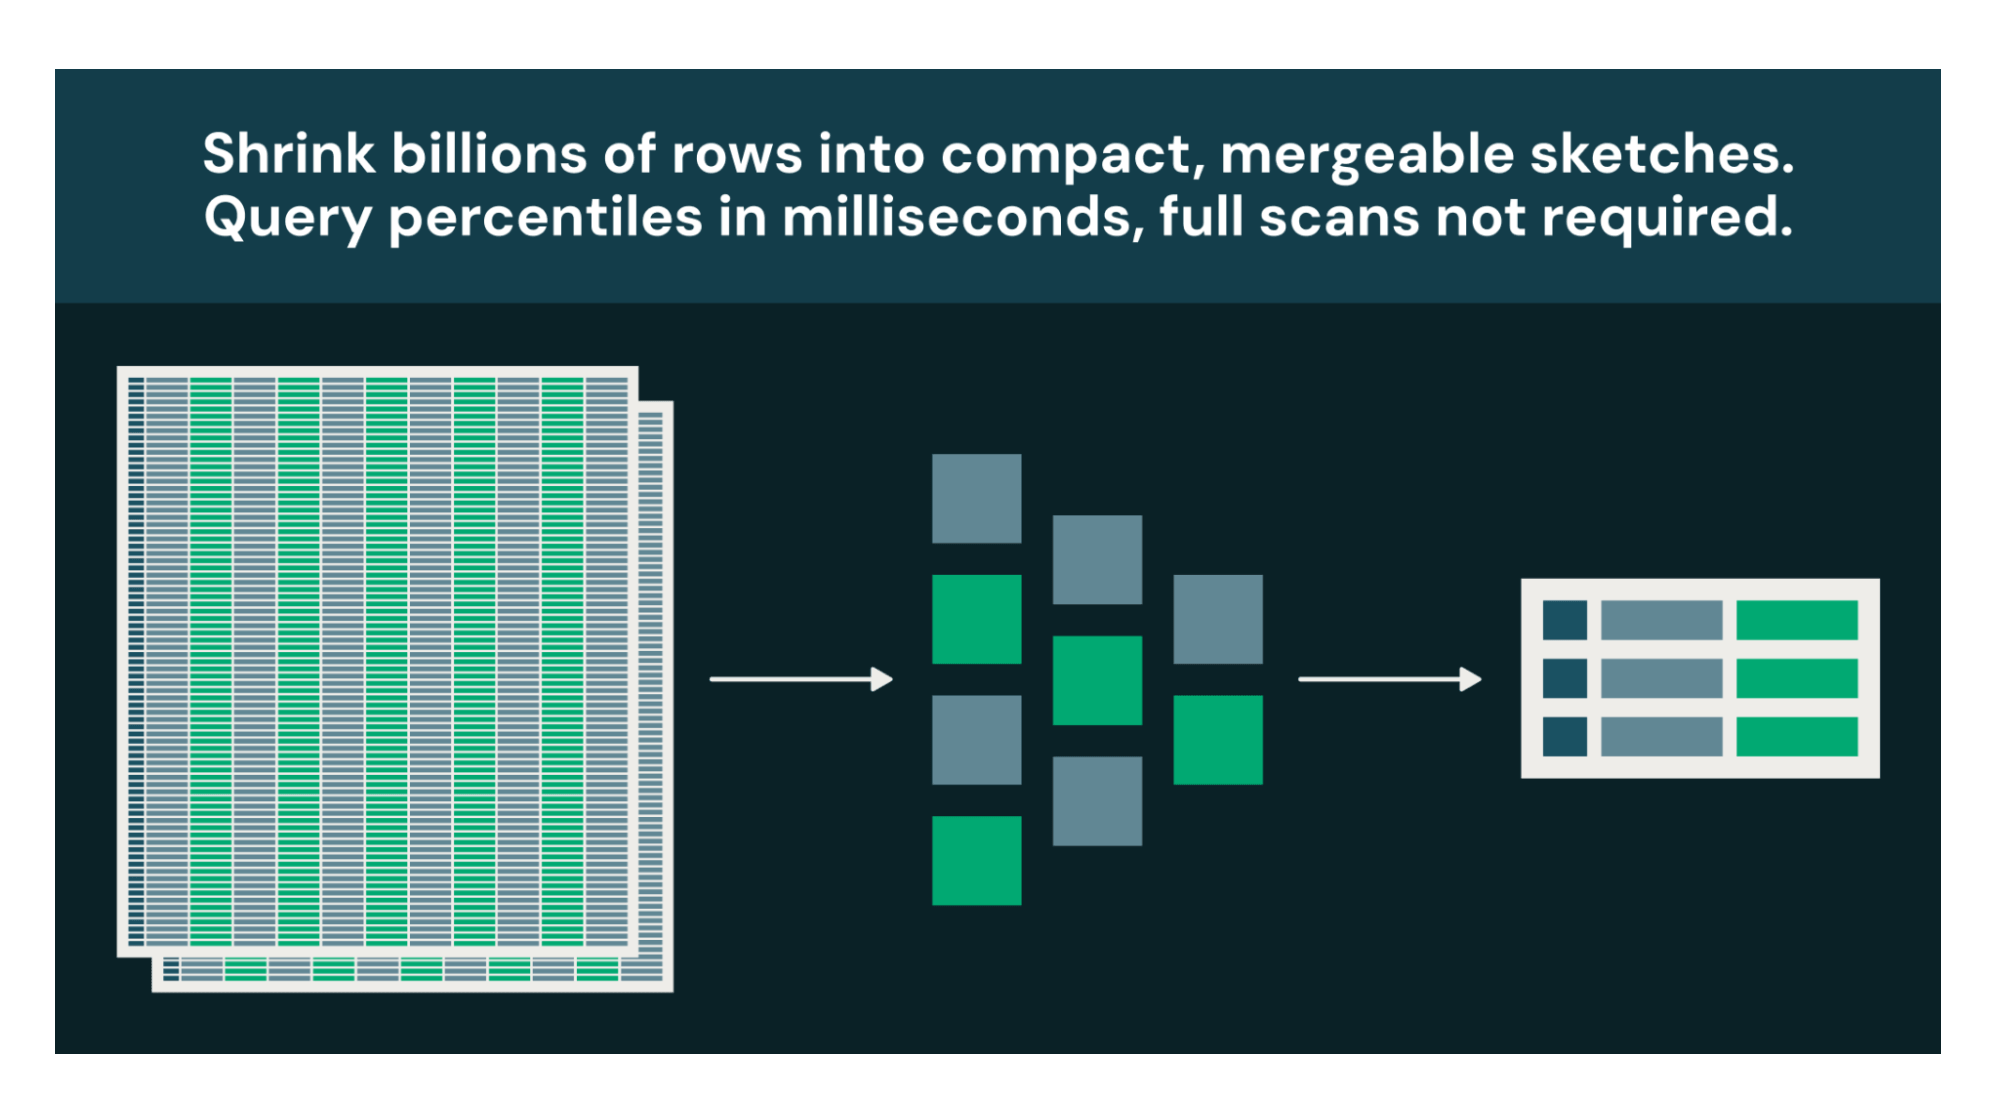
Large-scale datasets compress into compact, mergeable sketches, enabling fast percentile queries and aggregations without scanning raw data.
Many analytical questions are decision-support, not audit. If knowing "~4.7M unique users ±1%" leads to the same decision as "4,712,389 unique users," the approximate answer at a fraction of the cost is strictly better.
Every warehouse has a handful of queries that burn the most compute: percentiles that force global sorts, distinct counts that track every unique value, top-K rankings that reshuffle entire datasets. Databricks now supports four new sketch function families, built onApache DataSketches, that replace these exact computations with bounded-memory approximations. The tradeoff: 1-2% configurable relative error. The payoff: orders-of-magnitude less compute, plus sketches you can store, merge, and requery without touching raw data.
**Percentile calculations in milliseconds, not minutes**
When you call PERCENTILE(response_time_ms, 0.99) on a billion-row table, the engine must sort every value globally. A full cluster shuffle could take minutes and consume gigabytes of memory. For a dashboard that refreshes every 5 minutes, you're paying that cost over and over.
KLL sketches are compact and mergeable summaries, built to answer quantile questions. They let you replace this sort while using the same bounded memory, whether you process a thousand values or a trillion. Typical relative error is 1-2% and is configurable, well within the actionable range for latency monitoring, capacity planning, and anomaly detection.
sql
-- Build a sketch
SELECT kll_sketch_agg_bigint(response_time_ms, 200) AS sketch FROM web_logs;
-- Query the sketch
SELECT kll_get_quantile_bigint(sketch, 0.99) AS p99_latency FROM sketches;
The real advantage is the workflow sketches enable. Build them once during your daily ETL. Store them as columns in Delta tables. When a dashboard needs P50/P90/P99 for any time range, merge the precomputed sketches in milliseconds instead of rescanning raw data. Extract multiple quantiles from a single sketch in one pass with kll_get_quantile_bigint(sketch, ARRAY(0.5, 0.9, 0.99)).
**Audience overlap analysis without the compute bill**
How many users saw your Super Bowl ad but not your Instagram campaign? Audience overlap analysis is core to marketing measurement. You need to know total reach (users who saw any campaign), overlap (users who saw multiple campaigns), and exclusive reach (users who saw only one campaign). But exact computation requires collecting every user ID into memory and performing set operations across potentially billions of identifiers. At scale, this becomes impractical or impossible.
Theta sketches summarize a set of distinct values in bounded memory and support full set algebra: unions, intersections, and differences. Build a sketch per campaign, then combine them mathematically:
sql
-- Build sketches for each campaign
WITH campaign_sketches AS (
  SELECT 'A' AS campaign, theta_sketch_agg(user_id) AS sketch FROM campaign_a
  UNION ALL
  SELECT 'B' AS campaign, theta_sketch_agg(user_id) AS sketch FROM campaign_b
)
SELECT
  -- Total unique users across both campaigns
  theta_sketch_estimate(
    theta_union(
      MAX(CASE WHEN campaign = 'A' THEN sketch END),
      MAX(CASE WHEN campaign = 'B' THEN sketch END)
    )
  ) AS total_reach,

  -- Users who saw BOTH campaigns
  theta_sketch_estimate(
    theta_intersection(
      MAX(CASE WHEN campaign = 'A' THEN sketch END),
      MAX(CASE WHEN campaign = 'B' THEN sketch END)
    )
  ) AS overlap
FROM campaign_sketches;
The exact approach would require a UNION to deduplicate, then a JOIN to find overlap, possibly shuffling raw user IDs twice across your cluster. With Theta sketches, you generate compact binary objects measured in kilobytes, and the**set operations happen locally in microseconds**. This makes daily reach curves, incrementality measurement, and cross-channel deduplication practical.
**Real-time leaderboards without reprocessing raw data**
What's trending right now? It's a simple question with an expensive exact answer: count every distinct value, store all those counts, shuffle them across your cluster, sort globally. For high-cardinality event streams like search logs or clickstreams, this is a batch job, not a live query.
Approximate top-K sketches track your most frequently occurring items in bounded memory and let you merge across partitions and time windows to extract results instantly. Rare items might be dropped, which is fine, because that’s not what you’re looking for.
sql
-- Build a sketch of the last hour's searches
SELECT approx_top_k_accumulate(search_term, 10000) AS sketch
FROM search_logs
WHERE search_time > current_timestamp() - INTERVAL 1 HOUR;

-- Extract the top 10 trending terms
SELECT approx_top_k_estimate(sketch, 10) AS trending_terms;
With approx_top_k_combine, your "trending this week" dashboard becomes a merge of 168 pre-computed sketches rather than a scan of billions of raw events. For streaming workloads, merge each micro-batch's sketch into a running total and display results in real time. What was once a batch job becomes a live leaderboard.
**Cardinality and revenue attribution in one pass**
Counting distinct customers is one query. Summing their revenue is another. Doing both correctly, without double-counting customers who appear in multiple periods, is the challenge.
Consider a common analytics question: “How many unique customers made a purchase this month, and what was their total revenue by region?” Typically, you would start with a large GROUP BY, deduplicating customer IDs while summing purchases across billions of transactions. And you can't simply add prior results together, customers appearing in both periods get double-counted and their revenue overstated.
Tuple sketches solve this by combining distinct counting and metric aggregation in a single, mergeable structure.
sql
-- Build daily sketches: distinct customers with their total spend
CREATE TABLE daily_revenue_sketches AS
SELECT
  date,
  region,
  tuple_sketch_agg_double(customer_id, purchase_amount, 12, 'sum') AS sketch
FROM transactions
GROUP BY date, region;

-- Query any date range instantly by merging sketches
SELECT
  region,
  tuple_sketch_get_estimate_double(
    tuple_sketch_union_double(sketch, 14, 'sum')
  ) AS unique_customers,
  tuple_sketch_get_sum_double(
    tuple_sketch_union_double(sketch, 14, 'sum')
  ) AS total_revenue
FROM daily_revenue_sketches
WHERE date BETWEEN '2024-01-01' AND '2024-01-31'
GROUP BY region;
Each sketch maps a distinct customer to its aggregated spend. When you merge across days, customer counts deduplicate automatically and revenue sums accumulate. Exact incremental computation would have you reprocessing from raw data every time the data range changed.
**Getting started with the right sketch**
**Function Family****Use Cases** KLL Quantile Sketches Percentiles (P50, P90, P99) Theta Sketches Set operations on distinct values Approximate Top-K Most frequent items Tuple Sketches Distinct counts and metric aggregations
**When to use sketches**: Dashboards, trend analysis, monitoring, marketing attribution -- any query where approximate answers are acceptable. The larger your dataset, the better. If you’re not sure what sketch to use, askGenie Code to help you know the right choice.
**When to stay exact**: Financial auditing, compliance reporting, or any use case where regulatory or business requirements demand precise values.
These four function families turn long-running queries into the cheapest in your warehouse. Build sketches once during ETL, store them in Delta, merge them on read. The raw data is still there when the auditors ask. For everything else, a 1% error margin and a 1000x speedup is a welcome trade-off.
All functions work in SQL, DataFrame, and Structured Streaming pipelines. Sketches created in Spark are interoperable with other systems in theApache DataSketches ecosystem. See documentation (1,2,3,4) for function signatures and examples and get started with sketches today.
_Special mention to Christopher Boumalhab (cboumalh on GitHub) for implementing and contributing the Theta sketch and Tuple sketch function families in Apache Spark._
Get the latest posts in your inbox
Subscribe to our blog and get the latest posts delivered to your inbox.
Sign up
*
Work Email
*
Country Country*
By clicking “Subscribe” I understand that I will receive Databricks communications, and I agree to Databricks processing my personal data in accordance with its Privacy Policy.
Subscribe

Why Databricks
Discover
Customers
Partners
Why Databricks
Discover
Customers
Partners
Product
Databricks Platform
- Platform Overview
- Sharing
- Governance
- Artificial Intelligence
- Business Intelligence
- Database
- Data Management
- Data Warehousing
- Data Engineering
- Data Science
- Application Development
- Security
Pricing
Integrations and Data
Product
Databricks Platform
- Platform Overview
- Sharing
- Governance
- Artificial Intelligence
- Business Intelligence
- Database
- Data Management
- Data Warehousing
- Data Engineering
- Data Science
- Application Development
- Security
Pricing
Open Source
Integrations and Data
Solutions
Databricks For Industries
- Communications
- Financial Services
- Healthcare and Life Sciences
- Manufacturing
- Media and Entertainment
- Public Sector
- Retail
- View All
Cross Industry Solutions
Solutions
Databricks For Industries
- Communications
- Financial Services
- Healthcare and Life Sciences
- Manufacturing
- Media and Entertainment
- Public Sector
- Retail
- View All
Cross Industry Solutions
Data Migration
Professional Services
Solution Accelerators
Resources
Learning
Events
Blog and Podcasts
Resources
Documentation
Customer Support
Community
Learning
Events
Blog and Podcasts
About
Company
Careers
Press
About
Company
Careers
Press
Security and Trust

Databricks Inc.
160 Spear Street, 15th Floor
San Francisco, CA 94105
1-866-330-0121
- [](https://www.linkedin.com/company/databricks)
- [](https://www.facebook.com/pages/Databricks/560203607379694)
- [](https://twitter.com/databricks)
- [](https://www.databricks.com/feed)
- [](https://www.glassdoor.com/Overview/Working-at-Databricks-EI_IE954734.11,21.htm)
- [](https://www.youtube.com/@Databricks)
© Databricks 2026. All rights reserved. Apache, Apache Spark, Spark, the Spark Logo, Apache Iceberg, Iceberg, and the Apache Iceberg logo are trademarks of the Apache Software Foundation.
- Privacy Notice
- |Terms of Use
- |Modern Slavery Statement
- |California Privacy
- |Your Privacy Choices
- !Image 11
We Care About Your Privacy
Databricks uses cookies and similar technologies to enhance site navigation, analyze site usage, personalize content and ads, and as further described in our Cookie Notice. To disable non-essential cookies, click “Reject All”. You can also manage your cookie settings by clicking “Manage Preferences.”
Manage Preferences
Reject All Accept All
Privacy Preference Center
Opt-Out Preference Signal Honored
Privacy Preference Center
- ### Your Privacy
- ### Strictly Necessary Cookies
- ### Performance Cookies
- ### Functional Cookies
- ### Targeting Cookies
- ### TOTHR
#### Your Privacy
When you visit any website, it may store or retrieve information on your browser, mostly in the form of cookies. This information might be about you, your preferences or your device and is mostly used to make the site work as you expect it to. The information does not usually directly identify you, but it can give you a more personalized web experience. Because we respect your right to privacy, you can choose not to allow some types of cookies. Click on the different category headings to find out more and change our default settings. However, blocking some types of cookies may impact your experience of the site and the services we are able to offer.
#### Opting out of sales, sharing, and targeted advertising
Depending on your location, you may have the right to opt out of the “sale” or “sharing” of your personal information or the processing of your personal information for purposes of online “targeted advertising.” You can opt out based on cookies and similar identifiers by disabling optional cookies here. To opt out based on other identifiers (such as your email address), submit a request in our Privacy Request Center.
#### Strictly Necessary Cookies
Always Active
These cookies are necessary for the website to function and cannot be switched off in our systems. They assist with essential site functionality such as setting your privacy preferences, logging in or filling in forms. You can set your browser to block or alert you about these cookies, but some parts of the site will no longer work.
#### Performance Cookies
- [x] Performance Cookies
These cookies allow us to count visits and traffic sources so we can measure and improve the performance of our site. They help us to know which pages are the most and least popular and see how visitors move around the site.
#### Functional Cookies
- [x] Functional Cookies
These cookies enable the website to provide enhanced functionality and personalization. They may be set by us or by third party providers whose services we have added to our pages. If you do not allow these cookies then some or all of these services may not function properly.
#### Targeting Cookies
- [x] Targeting Cookies
These cookies may be set through our site by our advertising partners. They may be used by those companies to build a profile of your interests and show you relevant advertisements on other sites. If you do not allow these cookies, you will experience less targeted advertising.
#### TOTHR
- [x] TOTHR
Cookie List
Consent Leg.Interest
- [x] checkbox label label
- [x] checkbox label label
- [x] checkbox label label
Clear
- - [x] checkbox label label
Apply Cancel
Confirm My Choices
Allow All

问问这篇内容
回答仅基于本篇材料Skill 包
领域模板,一键产出结构化笔记论文精读包
把一篇论文 / 技术博客精读成结构化笔记:问题、方法、实验、批判、延伸阅读。
- · TL;DR(1 段)
- · 研究问题与动机
- · 方法概览
投融资雷达包
把一条融资 / 创投新闻整理成投资人视角的雷达卡:交易要点、判断、竞争格局、风险、尽调清单。
- · 交易要点(公司 / 轮次 / 金额 / 投资人 / 估值,材料未明示则写 “未披露”)
- · 投资 thesis(这家公司为什么值得关注)
- · 竞争格局与替代方案