Faster fixes, less context sharing: how Grafana Assistant learns your infrastructure before you even ask
- Grafana Assistant自动构建环境知识库,缩短故障排查准备时间。
- 助手在收到问题前已掌握服务、连接、指标等信息,提升响应速度。
- 该技术革新了AI辅助监控,使对话直接聚焦于解决问题而非信息收集。
When an unexpected alert fires these days, most engineers' first move is to ask their AI assistant for help.You ask why your checkout service is slow and the assistant gets to work, but it can't get any meaningful insights—at least not quickly—without the proper guidance. So, the next thing you know you're sharing deals about your existing data sources, the services you have running, how they connect, which labels and metrics matter, and on and on.
Every conversation starts from scratch, and that discovery process eats into the time you actually need for troubleshooting.
But if you're using Grafana Assistant, our agentic observability assistant, you can skip right over all that context and dive straight into troubleshooting. Assistant doesn't learn about your environment on demand. Instead, it studies your infrastructure ahead of time and builds a persistent knowledge base. That way, by the time you ask your first question, it already knows what's running, how it's connected, and where to look.
Fostering a knowledge base to jumpstart incident response
Because Assistant automatically builds and maintains a knowledge base about your environment, it already knows what services you run, how they connect, which metrics and labels matter, where the logs live, and how things are deployed.
Think of it as giving the assistant a map of your world before it starts answering questions.
As a result, conversations become faster and more accurate. When you ask about a service, the assistant doesn't need to fumble through data source discovery. It already knows that your payment system talks to three downstream services, that its latency metrics live in a specific Prometheus data source, and that its logs are structured JSON in Loki.
When an incident hits, speed matters. Having that context preloaded can shave valuable minutes off of your response time even if you're experienced with the system. But this functionality is especially powerful for teams where not everyone has the full picture of the infrastructure. A developer investigating an issue in their service can ask about upstream dependencies and get accurate answers, even if they've never looked at those systems before.
How does it work?
Assistant runs this infrastructure memory in the background with zero configuration. A swarm of AI agents does the heavy lifting:
1. **Data source discovery:** The system identifies all connected Prometheus, Loki, and Tempo data sources in your Grafana Cloud stack.
2. **Metrics scans:** Agents query your Prometheus data sources in parallel to find services, deployments, and infrastructure components.
3. **Enrichments via logs and traces:** Loki and Tempo data sources get correlated with their corresponding metrics, adding context about log formats, trace structures, and service dependencies.
4. **Structured knowledge generation:** For each discovered service group, agents produce documentation covering five areas: what the service is, its key metrics and labels, how it's deployed, what it depends on, and how its logs are structured.
This knowledge is stored as searchable chunks in a vector database, so when you or the assistant need information about a specific service, it can be retrieved in milliseconds through semantic search.
The whole process refreshes automatically on a weekly cadence, so your assistant's understanding of your infrastructure stays current as your environment evolves.
What does the assistant actually learn?
For every service group it discovers, Assistant captures five categories of knowledge:
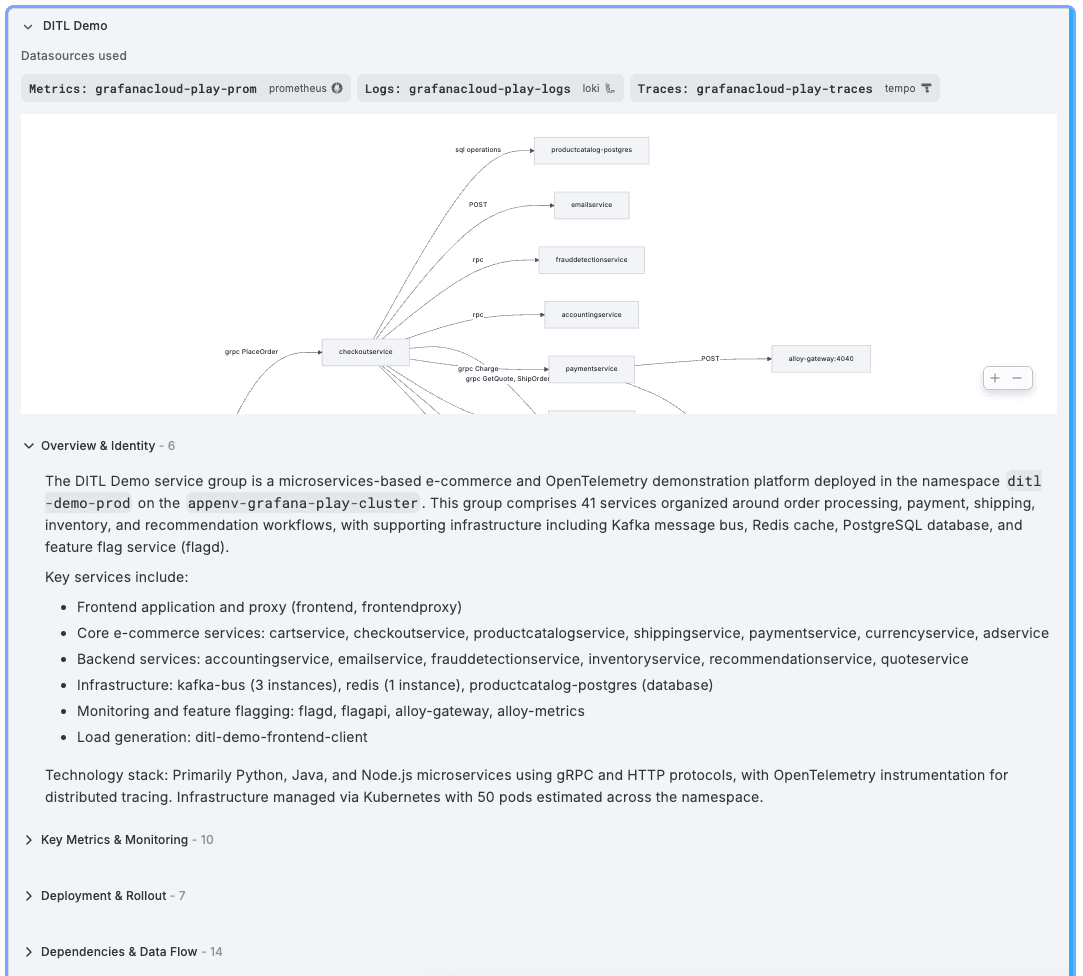
- **Identity and purpose:** What the service is, what it does, which namespace and cluster it belongs to, and what technology stack it uses
- **Key metrics:** The metric names and labels relevant to the service, including golden signals such as latency, error rate, traffic, and saturation. Not generic guesses, but the actual metric names from your Prometheus data sources
- **Deployment topology:** Kubernetes resources, replica counts, scaling configurations, and container details
- **Dependencies:** Upstream and downstream service connections, database and cache relationships, message queue interactions, and external integrations
- **Log structure:** Available log labels and their values, detected log formats (JSON, logfmt, or unstructured), common patterns, and extracted field names
This is the kind of context that makes the difference between an assistant that gives you a generic answer and one that gives you the right answer for your environment.
You don't have to do anything
This isn't a feature you configure, enable, or maintain. It runs automatically for all Grafana Cloud customers who use Assistant. There are no setup steps, no configuration files, no scheduled jobs to manage.
Your existing telemetry data is the input. The assistant reads what's already in your Prometheus, Loki, and Tempo data sources and builds its understanding from there. If you have metrics, you get this infrastructure memory capability.
You can review what the assistant has learned by navigating to the Assistant settings and browsing the discovered service groups. You can also trigger a manual scan if you want to refresh the knowledge base ahead of the next automatic cycle.
Assistant also respects your organization's access controls. Each memory is linked to the data sources used to generate it, so users only see knowledge derived from data sources they have permission to access.
A foundation for smarter conversations
This is one of those features that works best when you don't notice it. You ask a question, you get a precise answer that references the right metrics, the right labels, the right data sources. You don't have to wonder whether the assistant actually understands your environment. It does, because it already mapped it.
For us, this is a step toward an assistant that genuinely understands the infrastructure it's helping you observe and knows your system well enough to ask the right questions on its own.
_Grafana Cloud_ _is the easiest way to get started with metrics, logs, traces, dashboards, and more. We have a generous forever-free tier and plans for every use case._ _Sign up for free now!_
Tags
问问这篇内容
回答仅基于本篇材料Skill 包
领域模板,一键产出结构化笔记论文精读包
把一篇论文 / 技术博客精读成结构化笔记:问题、方法、实验、批判、延伸阅读。
- · TL;DR(1 段)
- · 研究问题与动机
- · 方法概览
投融资雷达包
把一条融资 / 创投新闻整理成投资人视角的雷达卡:交易要点、判断、竞争格局、风险、尽调清单。
- · 交易要点(公司 / 轮次 / 金额 / 投资人 / 估值,材料未明示则写 “未披露”)
- · 投资 thesis(这家公司为什么值得关注)
- · 竞争格局与替代方案